So, in my other life I’m actually a science teacher, and as it usually gets round that I’m “good with computers” I usually get asked to have a look at a few things. Twice in the last few months I’ve been asked if I’d set up conditional formatting in excel to colour code student test results compared to their target grades. Whilst not exactly related to the core content of this site, it is still DIY technical help so I decided to publish a full set of instructions here. Enjoy…
 First you need a lookup sheet
- Create a new sheet in the workbook.
- Fill in 2 columns – the left with grades (1c, 1b, 1a, 2c etc) and the right with a “score” value (can just be 1, 2, 3, 4, 5 etc)
- Fill in 2 additional columns with a “reverse lookup” which is the same as before but with the 2 columns reversed
- Highlight the full left hand table that you’ve created, right click on it, and select “define name”. Give it a name, ਉਦਾਹਰਨ ਲਈ. “lookup”
- Highlight the second table you created, right click and define another name. Give it a name, ਉਦਾਹਰਨ ਲਈ. “reverse_lookup”
 Creating the worksheets
- Now create a worksheet for each class, group or year (as suits). Include a column for target grades and various columns for test or assessment results (ਉਦਾਹਰਨ ਲਈ. as below)
- Note in this example that target data is in C3 – C5. Results are in D3 – F5
Building the basic conditional formatting
- Select cell D3 – the top left of the results data cells. Make sure you are on the “home” tab and click on “conditional formatting” and select “new rule”
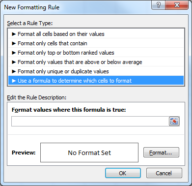
- Select “use a formula to determine which cells to format”
- What we want to do is compare the current cell to the target, but it isn’t quite as simple as that, because of the way excel compares values – so we need to use the lookup tables.
- We also need 5 rules – 2 sublevels or more below, 1 below, on target, 1 above and 2 or more above. You can create more rules if you want more detail or less if you just want below, on and above target.
- The eventual formula for 2 sublevels or more below will be
=VLOOKUP($C3,Lookup,2,FALSE)-1>VLOOKUP(D3,Lookup,2,FALSE)
- The C3 in the first part refers to the top target cell, and the D3 refers to the top actual result cell. The “Lookup” refers to the lookup table range that we named earlier.
- To break this down – we’re looking up numerical values for both the target and the actual score in the current cell. Because we want 2 sublevels or more below we take 1 off the target and say it must still be greater than the score. The $ before the C of C3 ensures that when we use the same formula for other columns they will still be compared to the targets column.
- Now click on format and apply the formatting you want. I use a background colour of light red
- Now we have created 1 of 5 rules for a single cell.
 Expanding the conditional formatting for multiple rules
- Next repeat the process to create 4 more rules.
- When all are finished my 5 examples would look as below. Only the comparison and possible addition or subtraction change between them. Also note the order (which we come to next)
=VLOOKUP($C3,Lookup,2,FALSE)-1>VLOOKUP(D3,Lookup,2,FALSE)
=VLOOKUP($C3,Lookup,2,FALSE)>VLOOKUP(D3,Lookup,2,FALSE)
=VLOOKUP($C3,Lookup,2,FALSE)=VLOOKUP(D3,Lookup,2,FALSE)
=VLOOKUP($C3,Lookup,2,FALSE)+1<VLOOKUP(D3,Lookup,2,FALSE)
=VLOOKUP($C3,Lookup,2,FALSE)<VLOOKUP(D3,Lookup,2,FALSE)
- I use medium red, light red, yellow, medium green and light green (in that order) for background colours
Sorting the order of the rules
- Finally, we need to make sure the rules are in the right order, and apply them to ALL the results cells, not just the single result cell D3.
- Click on the conditional formatting button again and choose “manage rules…”
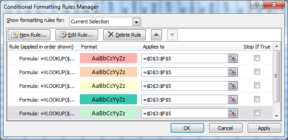
- Make sure the rules are in the right order – as above (medium red, light red, yellow, medium green, light green)

- Click in the “Applies to” box and enter the full range of cells which will contain results. In my example this is
=$D$3:$F$5. Put this in all 5 “applies to” boxes - This sheet should now fully work with conditional formatting
Expanding easily to additional sheets
- To apply to other sheets simple copy and paste a single cell which already has conditional formatting applied to it, into the new sheet.
- Then click on the conditional formatting button, select manage rules, and change the 5 “applies to” boxes to point to the cells of the new sheet which need conditional formatting


Hi John,
Do you have an example of a sheet you have made? Struggling following the steps here!
I would love to re-post this article on my own website, would that be okay?
Sure, as long as you drop in a link to the original article here 🙂
Hi,
Great tutorial — thanks. I’ve got 3 different colours working perfectly but the 2 above and 2 below aren’t formatting to their correct colours. They are changing to red and green but not the shades that they need to change to. Any suggestions please?
Thanks,
Gary
Sorry for the long delay in replying Gary — I’ve been busy migrating the site to our new VPS. Did you manage to get this sorted? If you didn’t then by all means zap me over your excel file to have a look at. I’ll recheck this guide in the next day or 2 to make sure there aren’t any typo’s or misleading parts, it’s been known to happen 😉
I have followed all your instructions above but none of my cells have gone coloured?? Any suggestions where I’m going wrong??
I assume you have populated them with data, and the target column is also populated with data?
By all means zap me the file over and I’ll take a quick look — I’ve e‑mailed you